Cleveland County Data Visualization
Design Challenge: Create a data visualization that successfully informs the viewer of a social/economic/political problem in Oklahoma.
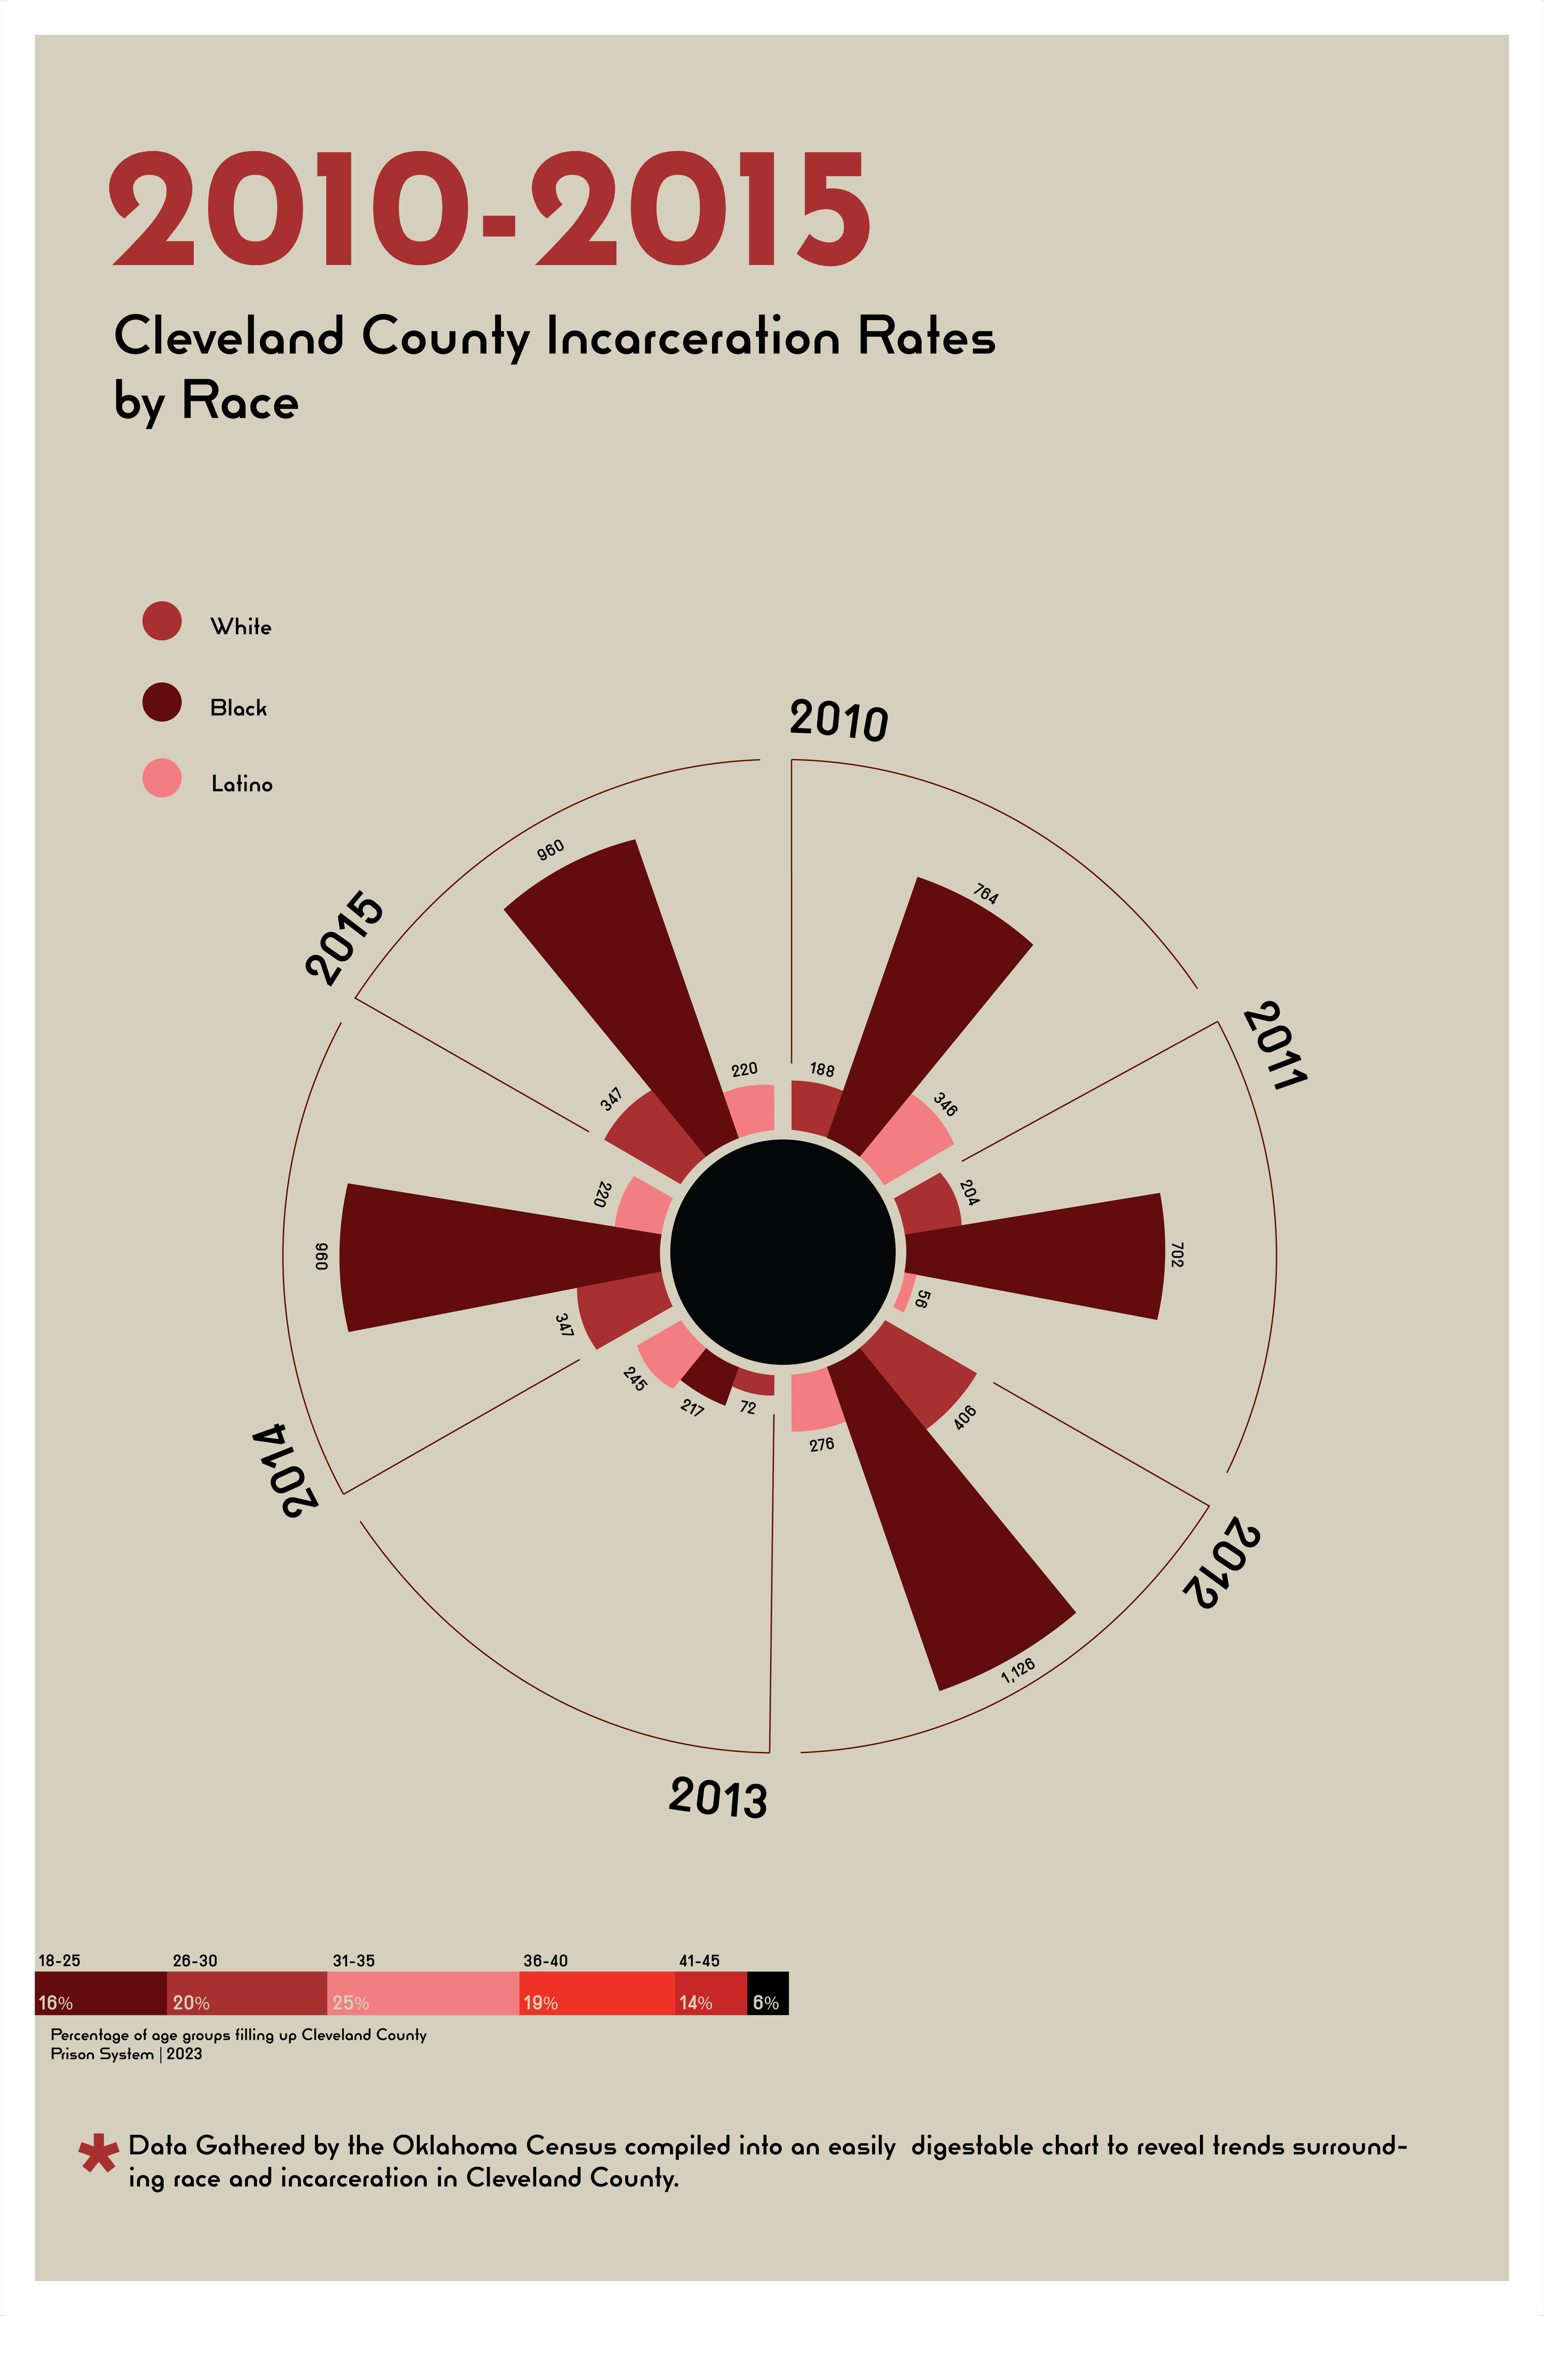
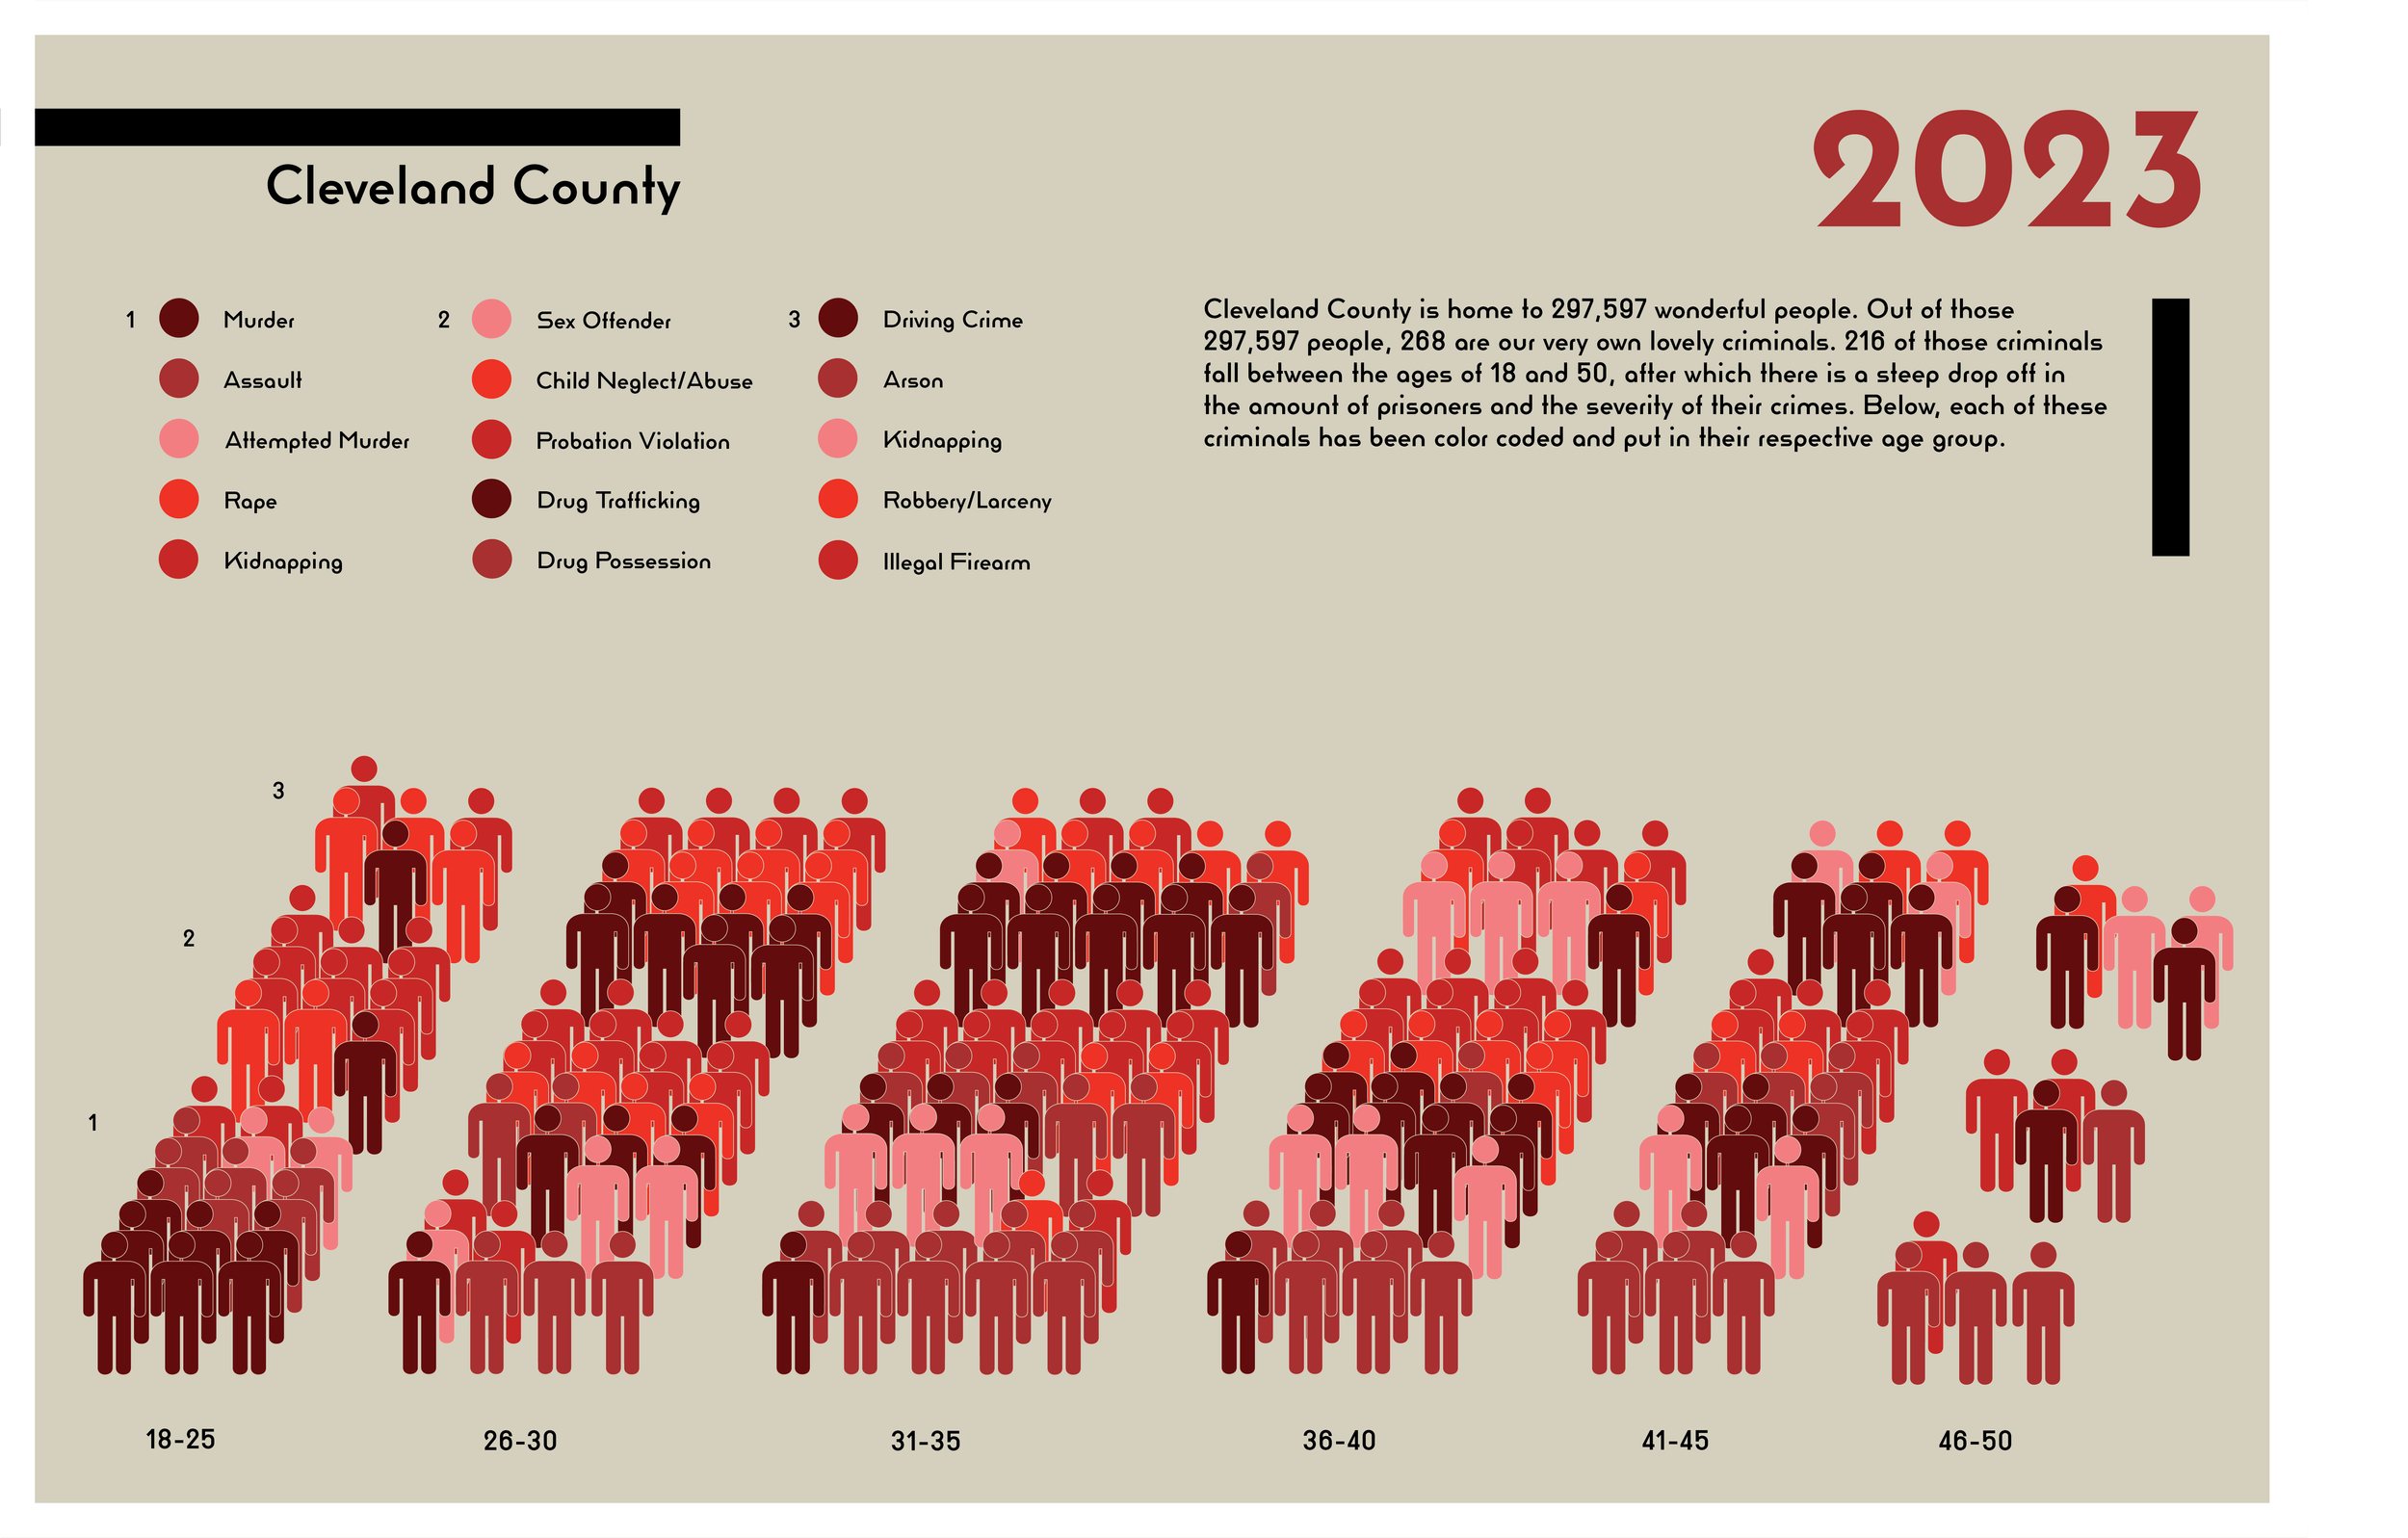
Data was gathered surrounding incarceration rates, demographics, and crime types to build a comprehensive poster series that aims to inform the viewer. The typefaces were chosen to convey a political feeling while the colors represent the state of Oklahoma itself.